How much should we spend on security?
Every security budget faces the same question from leadership: prove it's worth it. This guide gives you the real-world breach data from the IBM Cost of a Data Breach Report 2024 and a concrete ROI framework to make the case. So the next time someone asks "How much should we spend on security?", you answer with numbers, not guesses.
TL;DR
- Flat-percentage budgets (5-15% of IT spend) ignore your actual risk exposure, leaving dangerous funding gaps.
- The average data breach now costs $4.88M globally and $10.22M in the U.S., based on 604 real breaches studied by IBM.
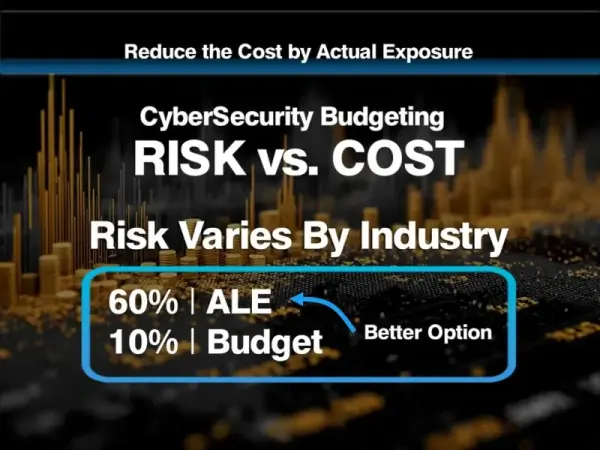
- Risk-based budgeting using Annual Loss Expectancy (ALE) reframes security spending as measurable ROI, not a cost center.
- AI-powered security tools save an average of $2.22M per breach; incident response plans save $1.49M.
- Skills shortages (+$1.76M) and non-compliance (+$1.55M) are the biggest cost amplifiers when a breach occurs.
The Security Spending Gap: Where Most Budgets Get It Wrong
Most organizations set their security budget using one of two flawed methods: a flat percentage of IT spend (typically 5-15%) or peer benchmarking ("Company X spends $2M, so we should too"). Neither accounts for your actual risk exposure. The result is a spending gap, either dangerously underfunded or wastefully over-allocated in the wrong areas.
The IBM 2024 data makes this gap visible. Consider a mid-market company with 1,000 employees:
| Approach | Method | Budget | Context |
|---|---|---|---|
| Typical (flat %) | 10% of IT budget | $800K | Based on industry averages, no risk context |
| Risk-based | Breach exposure: $4.87M | $1.2M | Targets 60% ALE reduction, 143% ROI on spend |
The flat-percentage approach leaves this company $400K short of what the data says they need. That gap translates directly into unmitigated risk: slower incident response, unpatched systems, and no budget for the breach that IBM says costs $4.87M on average for their size.
The $400K difference isn't overspending. It's the gap between guessing and knowing.
A risk-based budget starts with your actual threat exposure, then works backward to determine what controls are worth funding. The sections below give you the benchmark data to build that case. (New to ALE and the formula behind it? See our Annual Loss Expectancy resource page for the fundamentals.)
IBM Cost of a Data Breach 2024: The Numbers
IBM's annual report surveyed 604 real breaches across 16 countries and 17 industries. These are not projections or estimates. They are actual costs incurred by breached organizations.
| Segment | Average Breach Cost |
|---|---|
| Small business (<500 employees) | $3.31M |
| Mid-market (500-1K employees) | $3.29M |
| Mid-enterprise (1-5K employees) | $4.87M |
| Global average | $4.88M |
| Financial services | $6.08M |
| Healthcare | $9.77M |
| U.S. average | $10.22M |
For context: Equifax's 2017 breach cost $1.38 billion in total. Target's 2013 breach exceeded $200 million. These are the outliers that drive the averages up, but the averages themselves are already alarming for organizations of any size.
Mapping Benchmarks to Your Budget
Here's where most CISOs go wrong: they present security budgets as a cost center instead of a risk reduction function. ALE reframes the conversation into a cost-benefit analysis with teeth. The FAIR framework provides a structured methodology for exactly this kind of quantitative analysis.
Definition: Annual Loss Expectancy (ALE)
ALE is the expected monetary loss from a specific threat over one year. It's calculated as: ALE = Single Loss Expectancy (SLE) x Annualized Rate of Occurrence (ARO). In plain English: how much a breach costs you, multiplied by how often you expect it to happen. This is the number that turns "we need more security budget" into "here's the ROI."
Example: Mid-Market Company (1,000 employees)
Using the IBM data:
- ALE baseline: $4.87M (expected annual breach cost)
- Current security budget: $1.2M (typical 4-6% of IT spend)
- Security controls reduce ALE by an estimated 60%: $2.92M reduction
- Net ROI: $2.92M - $1.2M = $1.72M in avoided losses
That's not a cost. That's a 143% return on investment. Present it that way.
Example: Small Business (200 employees)
- ALE baseline: $3.31M
- Security budget: $250K
- Controls reduce ALE by 40%: $1.32M reduction
- Net ROI: $1.32M - $250K = $1.07M in avoided losses
Even modest security programs deliver significant returns when measured against real breach costs. CISA's free resources can help small organizations get started without a large budget.
| Metric | Mid-Market (1,000 emp.) | Small Business (200 emp.) |
|---|---|---|
| ALE Baseline | $4.87M | $3.31M |
| Security Budget | $1.20M | $0.25M |
| ALE Reduction | -$2.92M (60%) | -$1.32M (40%) |
| Net ROI | 143% | 428% |
| Avoided Losses | $1.72M | $1.07M |
Smaller organizations typically show higher ROI due to lower baseline security investment relative to potential loss exposure.
The Budget Justification Framework
When presenting to the board, use this playbook and structure the argument in three parts:
- Baseline risk: "Our ALE, based on industry benchmarks for our size and sector, is approximately $X million per year."
- Control effectiveness: "Our current security program, aligned with the CIS Controls and the NIST Cybersecurity Framework, reduces this by Y%, saving $Z million annually."
- Proposed investment: "This additional $W investment targets [specific threat category] and is projected to reduce ALE by a further $V, delivering a [percentage] ROI."
Every line item maps to a threat, an ARO, an SLE, and a measurable ALE reduction — accountability your CFO can verify. No hand-waving. No fear-based selling. Just math. The NIST SP 800-30 risk assessment guide provides the formal methodology for documenting this analysis.
Pro Tip: Lead With the Number They Care About
Boards don't think in CVEs or threat vectors. They think in dollars. Open with the ROI figure ("Our security program delivered 143% ROI last year"), then back into the methodology. If you lead with the ALE formula, you've already lost half the room.
Key Cost Amplifiers to Watch
The IBM report identifies several factors that significantly increase breach costs, and others that dramatically reduce them:
| Factor | Impact on Breach Cost | Category |
|---|---|---|
| AI-powered security tools | -$2.22M | Cost reducer |
| Incident response plan & testing | -$1.49M | Cost reducer |
| Security skills shortage | +$1.76M | Cost amplifier |
| Non-compliance with regulations | +$1.55M | Cost amplifier |
| Stolen or compromised credentials | +$1.49M | Cost amplifier |
| Cloud migration complexity | +$1.12M | Cost amplifier |
Organizations with AI-powered security tools saved an average of $2.22M per breach, and those with incident response plans saved $1.49M. Stolen credentials carried the longest identification time at 292 days — the detection gap anomaly detection tooling is built to close. Understanding where attacks originate, mapped to frameworks like MITRE ATT&CK, helps prioritize which controls deliver the greatest ALE reduction.
Expert Tip: Your Two Highest-ROI Investments
If your budget can only cover two things, the IBM data says these deliver the largest cost reductions: (1) AI-augmented security tooling ($2.22M average savings) and (2) a documented, tested incident response plan ($1.49M average savings). Together, they reduce average breach cost by $3.71M. That's more than the global average breach cost for a small business.
Put Theory Into Practice
Understanding ALE in a spreadsheet is one thing. Making budget decisions under pressure, with a boss second-guessing you, a board demanding ROI, and threats escalating through all 18 phases of the Unified Kill Chain, is something else entirely.
Corporate Cyber Defense is an interactive simulation where you manage a security budget against real-world tactics, techniques, and procedures. Every decision has a measurable ALE impact, every dollar spent must be justified, and the CFO is always watching. It's built on the same IBM benchmarks discussed in this article.
Choose your role. Choose your difficulty. See if your budget strategy survives 18 phases of a coordinated attack.
Play Corporate Cyber Defense →
Key Takeaways
- Flat-percentage budgets miss the mark: Spending 10% of IT budget on security without risk context can leave you $400K+ short of what breach data says you need.
- Breach costs are not theoretical: IBM studied 604 real breaches. The global average is $4.88M. Healthcare hits $9.77M. The U.S. average is $10.22M.
- ALE turns security into ROI: A $1.2M security budget that reduces $4.87M in annual loss exposure by 60% delivers 143% ROI. That's the language boards understand.
- AI and IR plans are the biggest cost reducers: Together, AI security tools (-$2.22M) and incident response plans (-$1.49M) save $3.71M per breach on average.
- Skills shortages are the biggest cost amplifier: Organizations lacking security talent pay $1.76M more per breach. Budget for people, not just tools.
- Present risk, not fear: Structure board presentations as baseline risk, control effectiveness, and proposed investment. Every line item maps to a measurable ALE reduction.
Frequently Asked Questions
What percentage of IT budget should go to cybersecurity?
The common answer is 5-15% of IT spend, but that's a flawed starting point. A risk-based approach is better: calculate your Annual Loss Expectancy (ALE) based on your industry, size, and threat landscape, then determine what controls reduce that exposure most cost-effectively. A healthcare company facing $9.77M in average breach costs needs a very different budget than a mid-market firm at $4.87M, even if their IT budgets are identical.
How do I calculate the ROI of cybersecurity spending?
Use this formula: ROI = (ALE Reduction - Security Investment) / Security Investment x 100. Start with your ALE baseline (use IBM's breach cost data for your industry and size as a benchmark). Estimate how much your security controls reduce that exposure (typically 40-60% for mature programs). Subtract your security budget from the reduction amount. For example: $2.92M reduction minus $1.2M investment = $1.72M net savings, or 143% ROI.
What is Annual Loss Expectancy (ALE)?
ALE is the expected monetary loss from a specific risk over one year, calculated as Single Loss Expectancy (SLE) x Annualized Rate of Occurrence (ARO). SLE is how much a single incident costs. ARO is how often you expect it to happen annually. If a breach costs your company $4.87M (SLE) and you estimate a 25% chance per year (ARO = 0.25), your ALE is $1.22M. This is the number that justifies your security budget in financial terms. See our ALE resource page for a deeper dive.
How do I present a cybersecurity budget to the board?
Structure it in three parts: (1) baseline risk ("our ALE is $X million based on industry data"), (2) current control effectiveness ("our program reduces this by Y%, saving $Z million"), and (3) proposed investment ("this additional spend targets [specific threat] for a projected [percentage] ROI"). Anchor everything in the IBM breach cost data and frameworks like FAIR. Lead with the ROI number, not the threat landscape. Boards respond to returns, not fear.
What are the biggest factors that increase data breach costs?
According to IBM's 2024 report, the top cost amplifiers are: security skills shortage (+$1.76M), non-compliance with regulations (+$1.55M), stolen or compromised credentials (+$1.49M, with the longest detection time at 292 days), and cloud migration complexity (+$1.12M). On the flip side, AI-powered security tools (-$2.22M) and tested incident response plans (-$1.49M) are the most effective cost reducers. Budget allocation should prioritize reducing these amplifiers and investing in proven reducers.
Data sourced from the IBM Cost of a Data Breach Report 2024. All figures represent averages from 604 real-world breaches studied between March 2023 and February 2024. Individual organizational risk varies based on industry, geography, security maturity, and attack surface.